Blog, 2016 Blogs
Framed – the DevOps dashboard framework
When multiple teams and resources are involved in development and operations, getting a clear cut picture on what is happening where is not easy. Though there are many tools like JIRA, Jenkins etc that gives its own unique dashboard, there is no single consolidated dashboard that gives the end-to-end delivery pipeline view. Collecting DevOps statistics from various tools is a challenge and Catalyst has solved this using its dashboard framework, that gives a 360 degree view of development, QA, Continuous Integration and deployment.
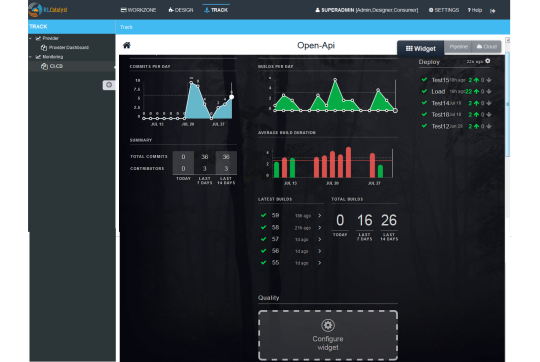
The framework has a highly flexible and configurable GUI, where widgets can be configured for different data sources/tools. The default view has multiple widgets for a team to get the 360 view of development and operations
- Project management – JIRA
- Commit – Github, Bitbucket and SVN
- Build – Jenkins
- Quality – Sonarqube
- Deployment – Octopus, XLDeploy and Urbancode
- Monitoring
- ChatOps
Each one of these widget support multiple sources and one can configure any source according to the project needs. Dashboards can be configured at 2 levels
- Team
Team level dashboards on story management, code commits, builds and deployment
- Product or program view
Rolled up view for the product that involves multiple teams – shows flow of commit from dev to prod environments
How it works
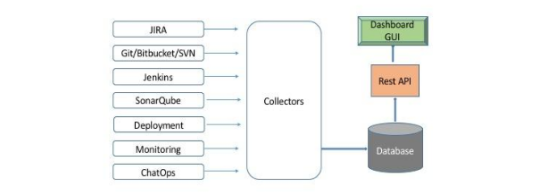
The framework runs collectors for each data source that collects and stores data from each source at a predefined interval. The aggregation layer will read these data, convert into meaningful information and send to the GUI layer and charts through the REST API calls.
Once the teams dashboards are configured in the widgets, the data is automatically collected in the back-end and the display gets refreshed every minute.
The JIRA dashboard, the team can see the features that are being developed in the running sprint – The working progress and features that are done
The code repo shows coding activities – who has committed, the trends
The Build dashboard shows the details of last 5 builds, the status of each one of these and the trends
The Quality dashboard shows the code coverage, unit tests, security analysis etc.
Deployment dashboard shows the deployment details per environment.
The framework can be extended to support any type of DevOps tools
Pipeline View
The product dashboard gives a roll-up view of the entire product that may include multiple components of each – feature management, code repository, jobs etc. It shows the flow of commits from development to testing to production stages as a pipeline view with appropriate details of unit and functional testing. It also gives the trends on product health and performance.